The main goal of this lab is to perform a classification accuracy assessment of an image which has previously been undergone land use/land cover image classification. It is necessary to conduct an accuracy assessment when producing a image classification as it is an important part of drawing conclusions from the output image. In order to complete an accuracy assessment we will be collecting ground reference points as testing samples and using those samples in order to perform the accuracy assessment.
Methods
The first step in the process of accuracy assessment is to generate ground reference testing samples. Prior to an image being assessed for accuracy, testing samples need to be collected. These points can be collected via field work before the actual land classification begins. Ground reference points are coordinate samples which are collected by some form of GPS. These points can also be created with the help of a high resolution image or aerial photograph.
For the first part of this lab exercise I will be creating ground reference points from an aerial image in ERDAS Imagine 2013. I'll use the coded, unsupervised classification image from lab 4, to act as a reference image. Next, I will open the accuracy assessment window under the raster tab. In this window the image from lab 4 is to be opened in the accuracy assessment window. Then I will specify the reference image as the 2005 image provided in this lab (Fig.1). After this has been done, it's time to generate the random points on the reference image which will later be used to determine the accuracy of the classified image produced in lab 4. To do this I will select the option, "add random points utility" which will generate random points throughout the reference image. Then once this is complete I can compare the reference values to the class values within the classified image.
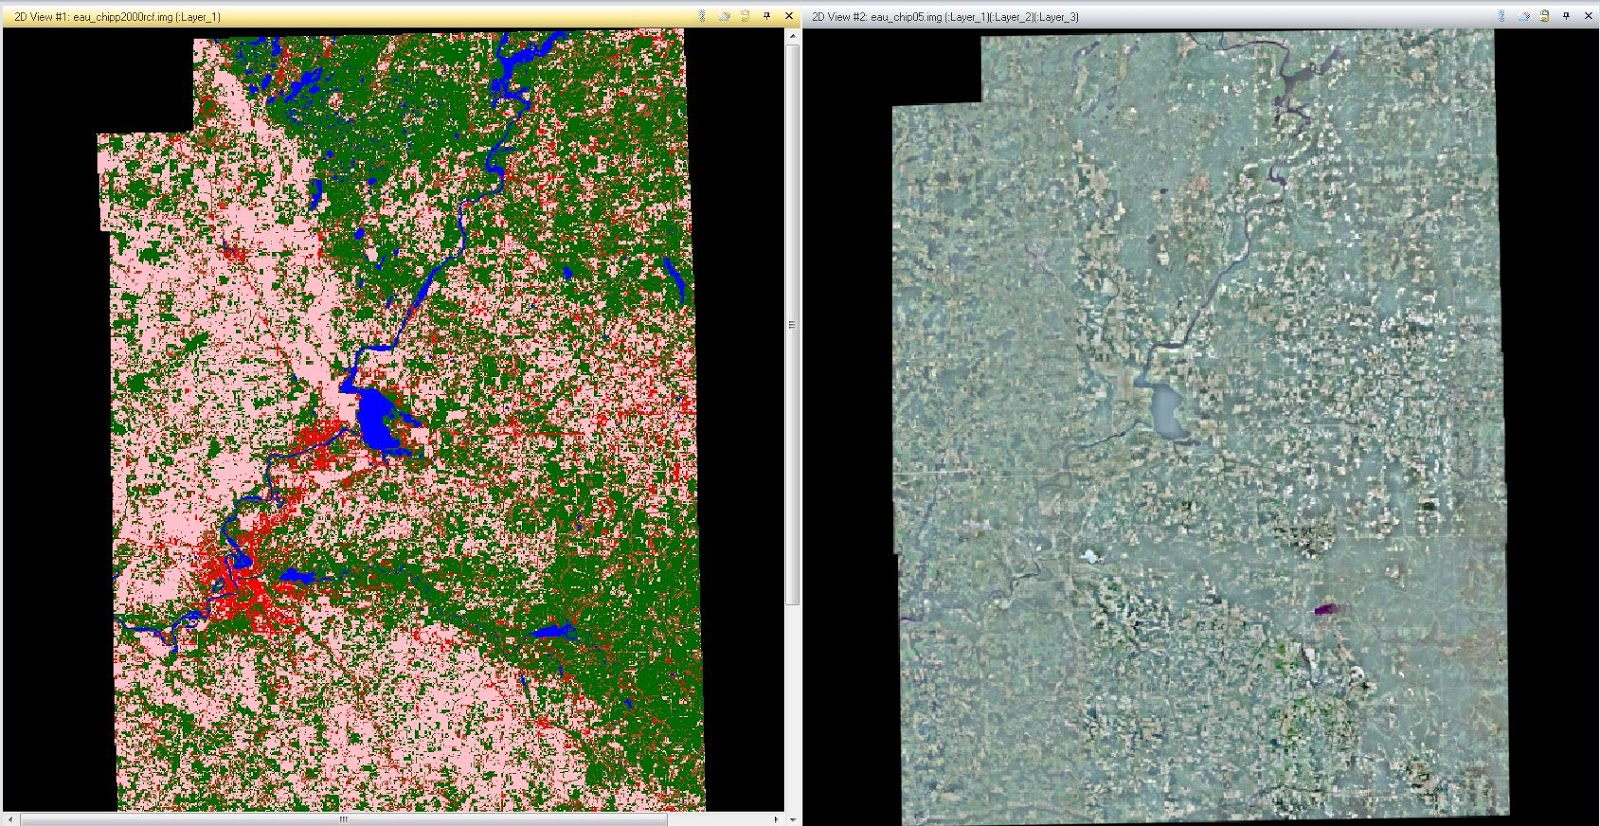
(Fig. 1) The image which I will be assessing the accuracy of is shown on the left while the image used to classify the reference points in the accuracy process is seen on the right.
When setting the conditions for the random points dialog, I will change the number of points to 125, select the stratified random distribution parameter and set the minimum points to 15. It is also important to highlight the select classes which we we used for land use/land cover classes in previous labs (water, forest, agriculture, urban/built-up and bare soil). Once all this is done it is time to click okay and the random points will be generated (Fig. 2).

(Fig. 2) This image shows the accuracy assessment tool which has generated 125 random ground reference points for the analyst to use to determine the accuracy of the image on the left.
Once the random ground reference points have been created it is time to classify them in order to evaluate them. To do this I will first highlight the first 10 reference points and select the view to show the selected points. By doing this it is easier to find each of the points. Starting with number 1, I will zoom into the point so I can determine the LULC class it belongs to. After I have determined which class it belongs to then I will put the corresponding number to the reference column that goes along with the classes from previous labs (1-water, 2-forest, 3-agriculture, 4-urban/built-up, 5-bare soil). This process will be repeated until all the data points have been classified (Fig. 3).

(Fig. 3) Each of the random ground reference points have been assigned a reference number which corresponds to a LULC class which will be used in the accuracy assessment process.
After that is done, it is time to produce the accuracy report to see how accurate our original image classification was. The accuracy report contains a great deal of information including: error matrix data, overall accuracy, producer's and user's accuracy and the Kappa statistics (Fig. 4).

(Fig. 4) The accuracy report produced after completing the accuracy assessment has a great deal of data.
For the rest of this lab I will conduct the same process in order to compare the accuracy of unsupervised classification and supervised classification in images. In the example above, the image which I am looking at the accuracy of was created by unsupervised image classification so I will conduct the exact same process with an image I produced using supervised image classification. Once the process is complete I can compare the different data found within the accuracy report to determine which method is more accurate.
Results
After completing two separate accuracy assessments for an unsupervised and a supervised classifications, I was able to determine that the supervised classification method is more accurate. While I did not find the difference to be as obvious as I initially expected there was definitely a difference in the two accuracy assessments. Not only was the overall accuracy greater in the image which had undergone supervised classification compared to the unsupervised, but the user's and producer's accuracy were greater for the LULC classes as well.
In completing this lab I now have the knowledge and skills to assess the accuracy of a land use/land cover classification. With this understanding, I can determine that the images I produced in previous labs are not accurate enough to be used in real world application as both were only about 60% accurate.
Sources
Data for this laboratory exercise was collected from the following data sources: Earth Resources Observation and Science Center (landsat satellite image), US Geological Survey and United States Department of Agriculture (USDA) National Agriculture Imagery Program (high resolution image). All data was provided by Dr. Cyril Wilson of the University Wisconsin- Eau Claire.
No comments:
Post a Comment